


Abstract
In a data rich infection prevention environment, data is likely available concerning infection rates, disinfection events, clinical events, facilities, employee training, inspections/audits, hand hygiene and more. Turning all this seemingly disparate data into an infection prevention strategy and action plan requires critical deployment of analysis and visualization tools.
Main Article
Data visualization has been helping people such as astronomers, cartographers, and surveyors since well before the early 17th Century when Michael Florent van Langren, a Flemish astronomer, created what is thought to be the first visualization of statistical data when he graphed conflicting longitude data. Turn the clock forward a couple of hundred years and data visualization first made its impact on infection prevention. In 1854 Dr. John Snow, a founding father of modern epidemiology, helped halt a cholera outbreak when he mapped cholera deaths [Figure 1] and proved it was transmitted via contaminated water (Vachon, 2005).

Figure 1: Dr. John Snow’s map shows the locations of public wells, and the cholera deaths mapped by home address, marked as black bars. PD-US
The growth of modern data visualization for infection prevention is in part fueled by Medicare’s effort to encourage quality improvements by reducing healthcare-acquired infections (HAIs) under the value-based care initiative (Paddock, 2007). In 2009, Medicare began penalizing acute care facilities by not covering “the costs of ’preventable’ conditions, mistakes and infections resulting from a hospital stay” (Paddock, 2007). In the last few years, an assortment of new tools and platforms such as dashboards, data discovery tools, analytics suites and more are enabling healthcare professionals and businesses to monitor their facilities and view their data in new ways. Correspondingly, the amount of data available to infection preventionists has exploded creating a perfect storm where data capture, visualization and analysis tools meet. This is leading to new and imaginative ways to extract meaningful, actionable data to improve patient outcomes and lower Medicare reimbursement penalties.
benefit of identifying rooms with recent infections and automatically launching additional disinfection procedures to lower the risks of subsequent HAIs
Take for example, the benefit of identifying rooms with recent infections and automatically launching additional disinfection procedures to lower the risks of subsequent HAIs. Additional actions might include deploying a mobile ultraviolet light or hydrogen peroxide vapor disinfection device in the room to eliminate pathogens that might remain on various surfaces. Patient outcomes are improved and penalty risks are lowered.
A robust data analysis tool may allow healthcare professionals to not only analyze and visualize infection data, it may provide for data modeling. In this example [Figure2], HAI rates and scores for Clostridioles difficile (formerly known as Clostridium difficile, and colloquially as C.diff) infections, Methicillin-resistant Staphylococcus aureus (MRSA) infections, Surgical Site Infections (SSI), Central Line-Associated Bloodstream Infections (CLABSI), and Catheter-Associated Urinary Tract Infections (CAUTI) are visualized. The information in this model can be manipulated to simulate the resulting high cost of the infections. Manipulation of the data lets the infection prevention team evaluate a return on investment for different scenarios, such as introducing different technologies or hospital practices. Imagine being able to estimate the costs savings on reducing a hospital’s C. diff scores by 25% in order to justify a new disinfecting procedure or purchases such as robotic UV or aersol misting disinfection devices or hand sanitation systems.
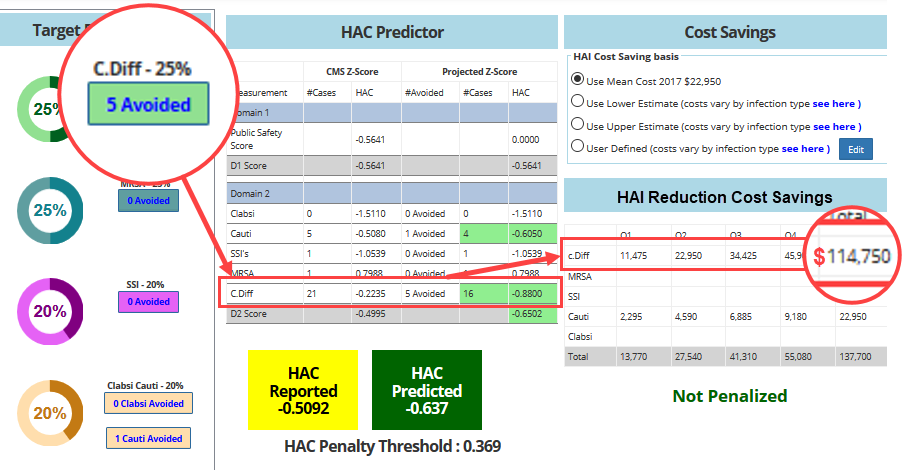
Figure 2: Using return on investment “what if” data modeling scenarios to analyze the cost savings of preventing infections. © 2014 HAIvia, LLC, all rights reserved.
Conclusion
The growth of data analysis in healthcare has been well documented (Healthcare Analytics Market by Type, 2019). Applying new data visualization and analysis technologies to infection control can create new insights that lead to better, faster informed decisions, identify important trends, and identify performance problems. Additionally, data analysis can boost competitive edge in today’s cost-controlled healthcare environment. Most importantly with the right tools and data collection, infection control professionals can harness the power of the growing data storm to focus on preventing HAIs rather than treating them, saving both lives and money.
References
Vachon, D. (2005). PART TWO: Doctor John Snow Blames Water Pollution for Cholera Epidemic. Retrieved from https://www.ph.ucla.edu/epi/snow/fatherofepidemiology_part2.html#TWO on Jan 9, 2019
Paddock, C. (2007). Medicare Will Not Pay For Hospital Mistakes And Infections, New Rule. Retrieved from https://www.medicalnewstoday.com/articles/80074.php on Jan 9, 2019
Healthcare Analytics Market by Type (Predictive, Prescriptive, Cognitive) Application (Clinical, RCM, Claim, Fraud, Waste, Supply Chain, PHM) Component (Service, Software) Delivery (On-demand, Cloud) End User (Payer, Hospital) – Global Forecast to 2024. (2019, January). Retrieved from https://www.marketsandmarkets.com/Market-Reports/healthcare-data-analytics-market-905.html on Jan 9, 2019


